RTR click & show
Features:
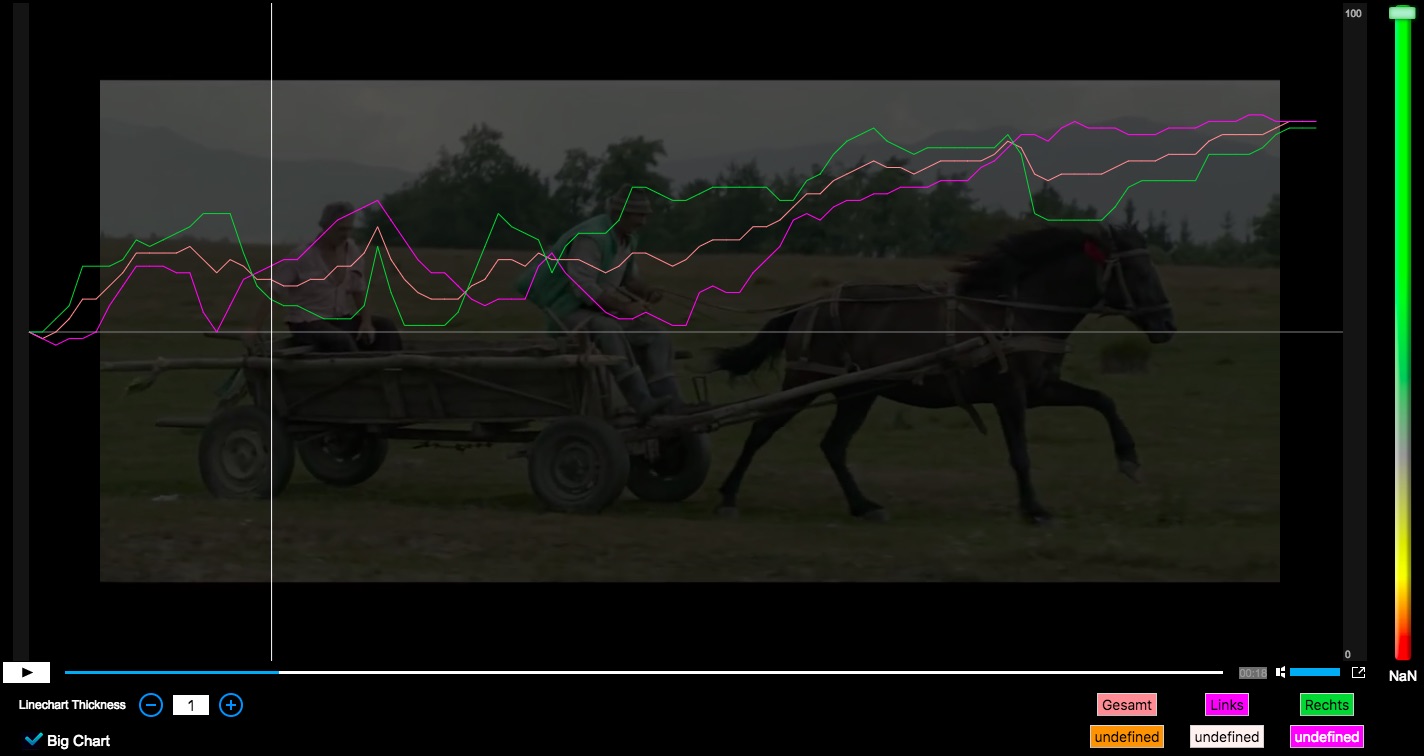
RTR click & show is a visual analysis tool for RTR data. It plays your video like in a traditional player, but also shows the rating curve (s). A vertical marker line runs on the timeline of the curve, which shows the corresponding curve position at the respective time of the video.
- By clicking on the curve, the film jumps to the appropriate location, which was fired at the time. This makes it easy and easy to check highs and low points of the valuation.
- Es können bis zu sechs Kurven angezeigt werden, von denen jede einzeln ausblendbar ist.
- Curve thickness and curve color can be set according to visualization requirements.
- The chart can be displayed either below the video or as a “big chart” overlay on the video.
- Individual video segments (e.g. individual parts of a news show) can be marked by vertical lines on the time axis.

